Execution Logs
FeatureMonitor and debug workflow execution in real-time
Overview
Execution logs provide real-time visibility into what your workflow is doing. Each action is logged with a status, and every node's input and output data is kept for you to inspect.
Viewing Logs
The Execution Results panel at the bottom of Visual Studio opens when a run starts (toggle it with Log in the header). It shows:
- Real-time logs - Watch each step as it executes, starting with the run's settings (profile, video recording, visibility)
- Status indicators - Each node in the Nodes column shows whether it succeeded, failed, was skipped or is still waiting
- Execution time - How long each node took
- Output data - Values extracted or returned by each node
Path Filter
For workflows with parallel execution (Parallel Split/Join nodes), use the path filter to focus on specific branches:
- All Paths - Show all logs from all branches
- Main - Show logs before split and after convergence
- Branch-1, Branch-2, etc. - Show logs from specific branches
Log Details
- Extracted data (text, attributes, etc.)
- Page URL at execution time
- Selector used
- Execution duration
- The error is shown in red in the logs
- The failed node is marked in the Nodes column
- Selecting it shows the error message alongside its input
Execution History
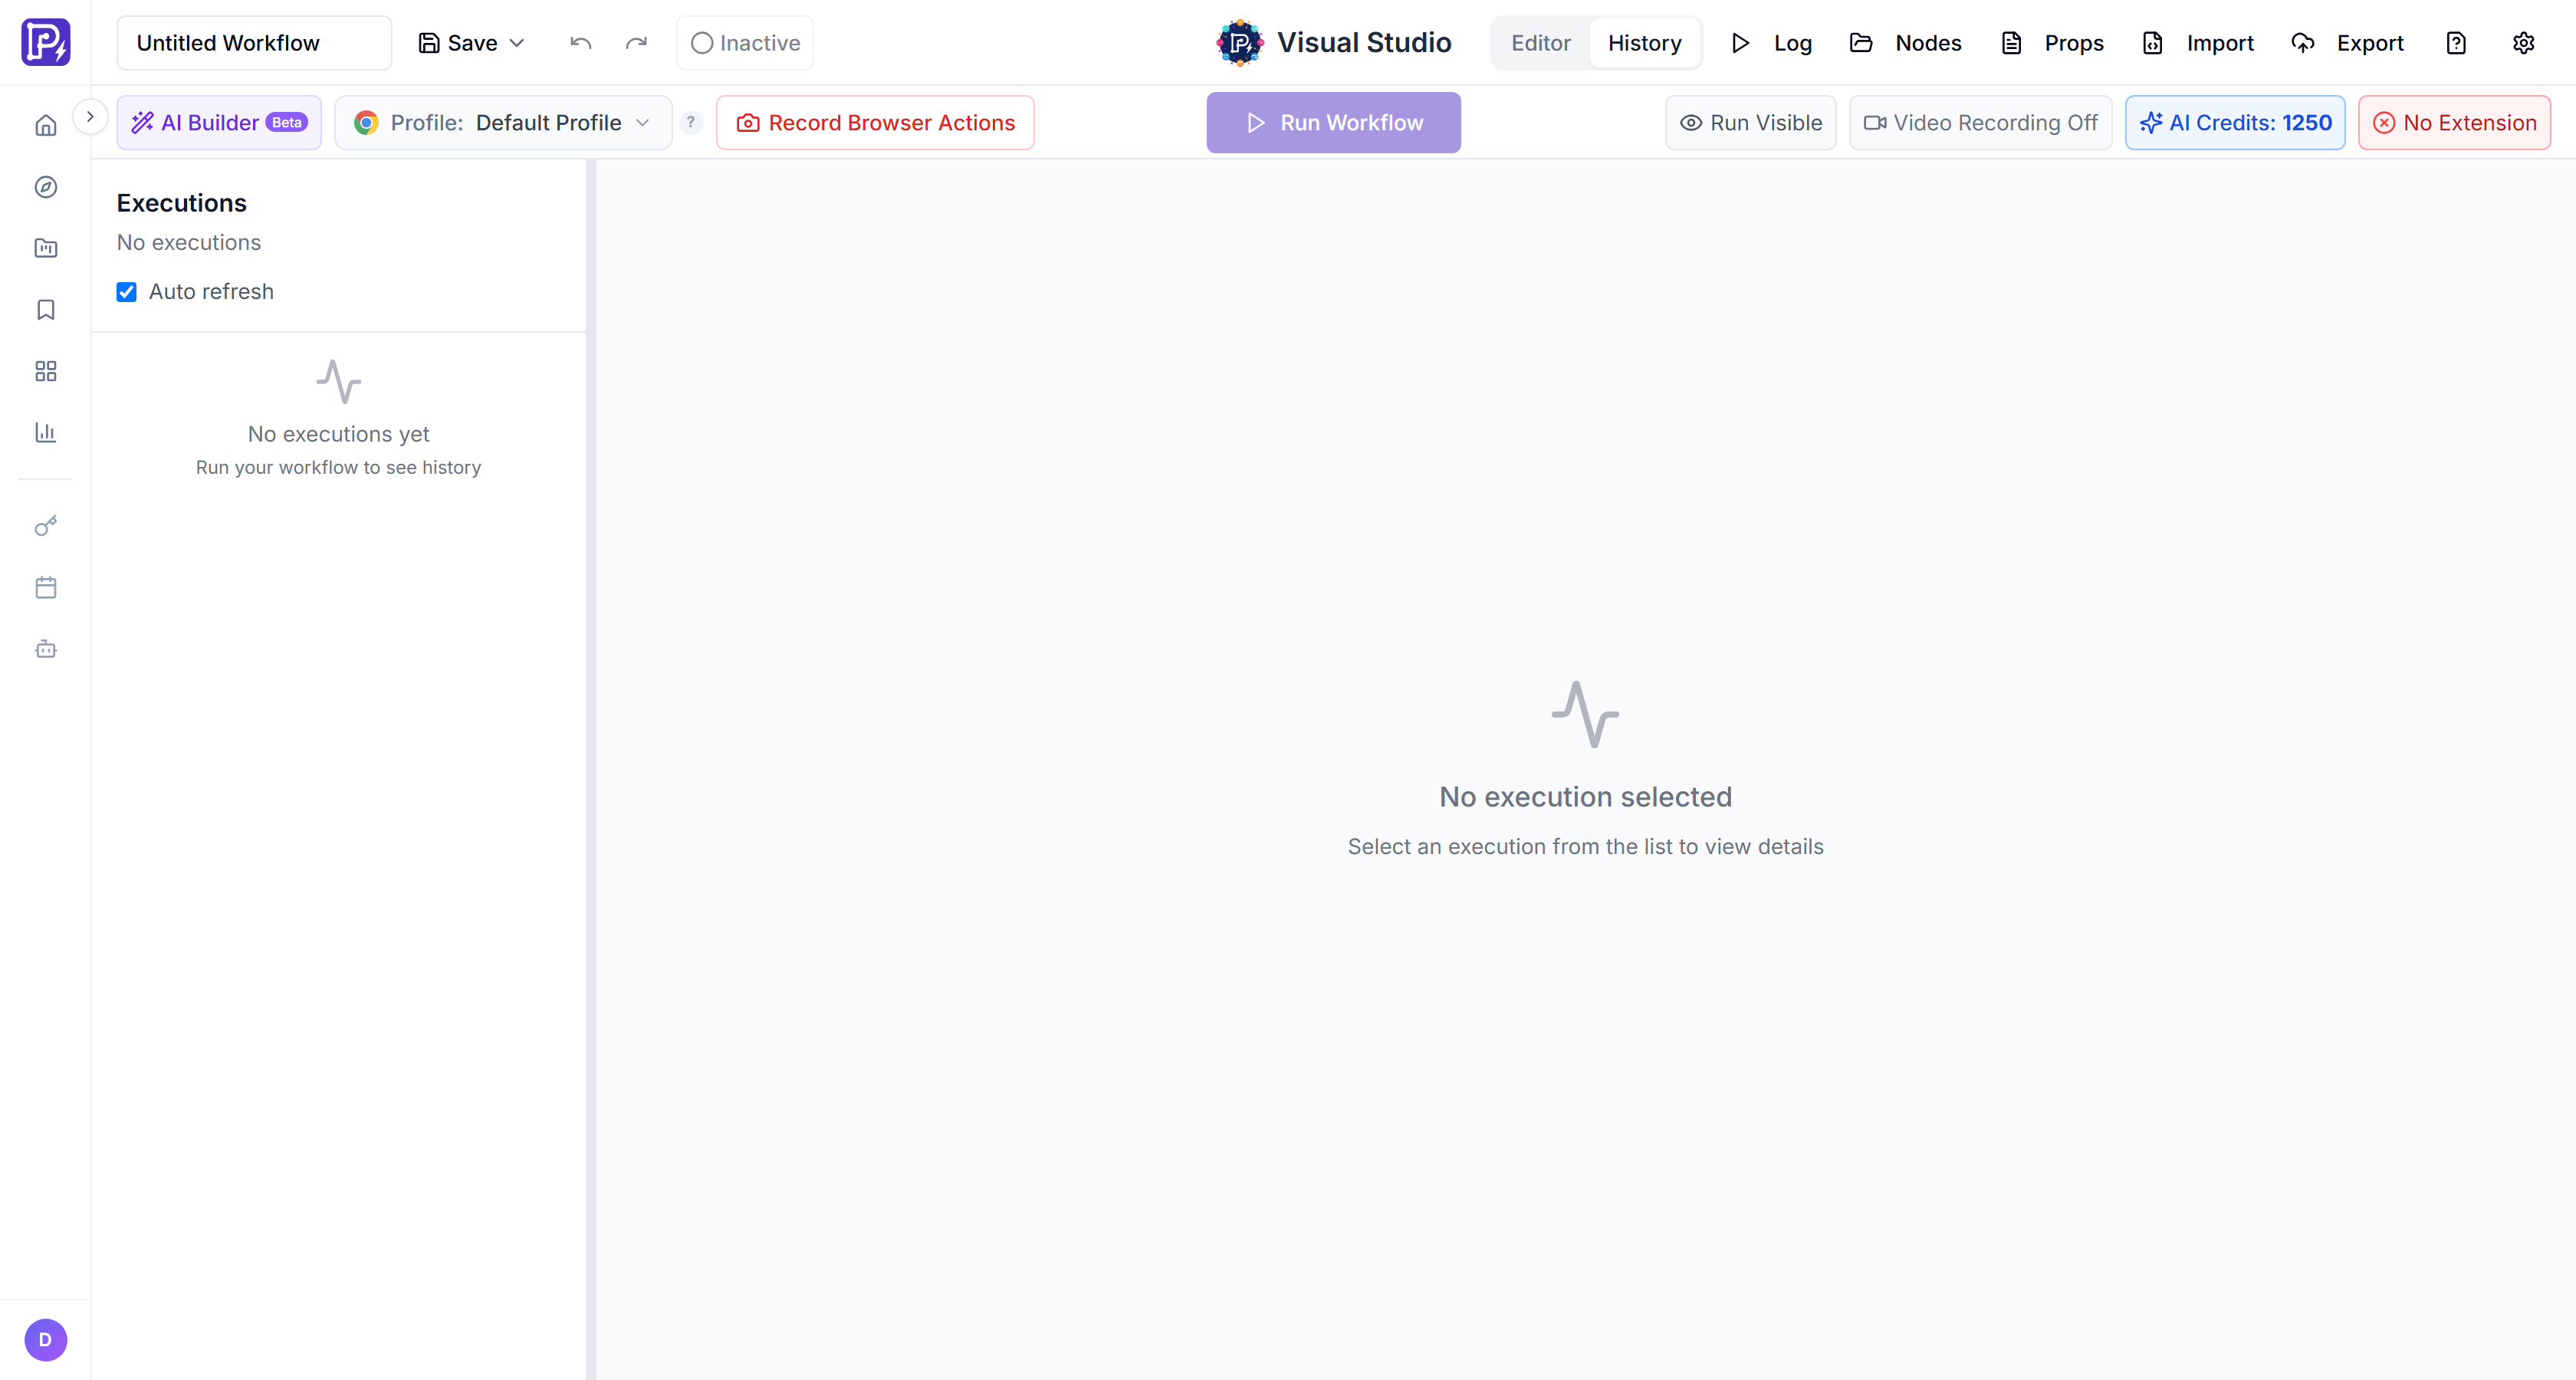
All workflow executions are saved in the execution history. Access it from:
- Visual Studio → History (the Editor / History toggle in the header)
- Dashboard → Execution History (
/dashboard)
Each entry shows: start time, status (Succeeded, Failed, Running or Stopped by user), duration, and who ran it. Click it to view the run's logs and each node's results, and Watch Recording if the run was recorded.